
Monitoring

Monitoring the Coal Creek ecosystem following the Marshall Fire

A team from CU Boulder is monitoring impacts of the Marshall Fire to the Coal Creek ecosystem and you can view the results on our public dashboard.

Interactive Water Quality Dashboard - Now Available!

We are excited to announce that you can now explore the 15+ years of water quality data our partners have collected in the Boulder St. Vrain Watershed. This dashboard includes the 2023 Water Quality Report, our first report to be featured in this digital format.

On this dashboard you can:

  • Scroll through the 2023 Water Quality Report, a curated report on the health of our watershed which includes data collected through 2023.
  • Use the Explore tool to access graphical trends of all the key parameters we monitor, upstream-to-downstream by basin, aggregated annually and monthly by year.
  • Check out our monitoring locations on the Map tool and see collected data by location on time series graphs.

Boulder St. Vrain Watershed Interactive Water Quality Dashboard

A map of the Boulder St Vrain Watershed with the locations of monitoring sites marked.

Collaborative Monitoring Program

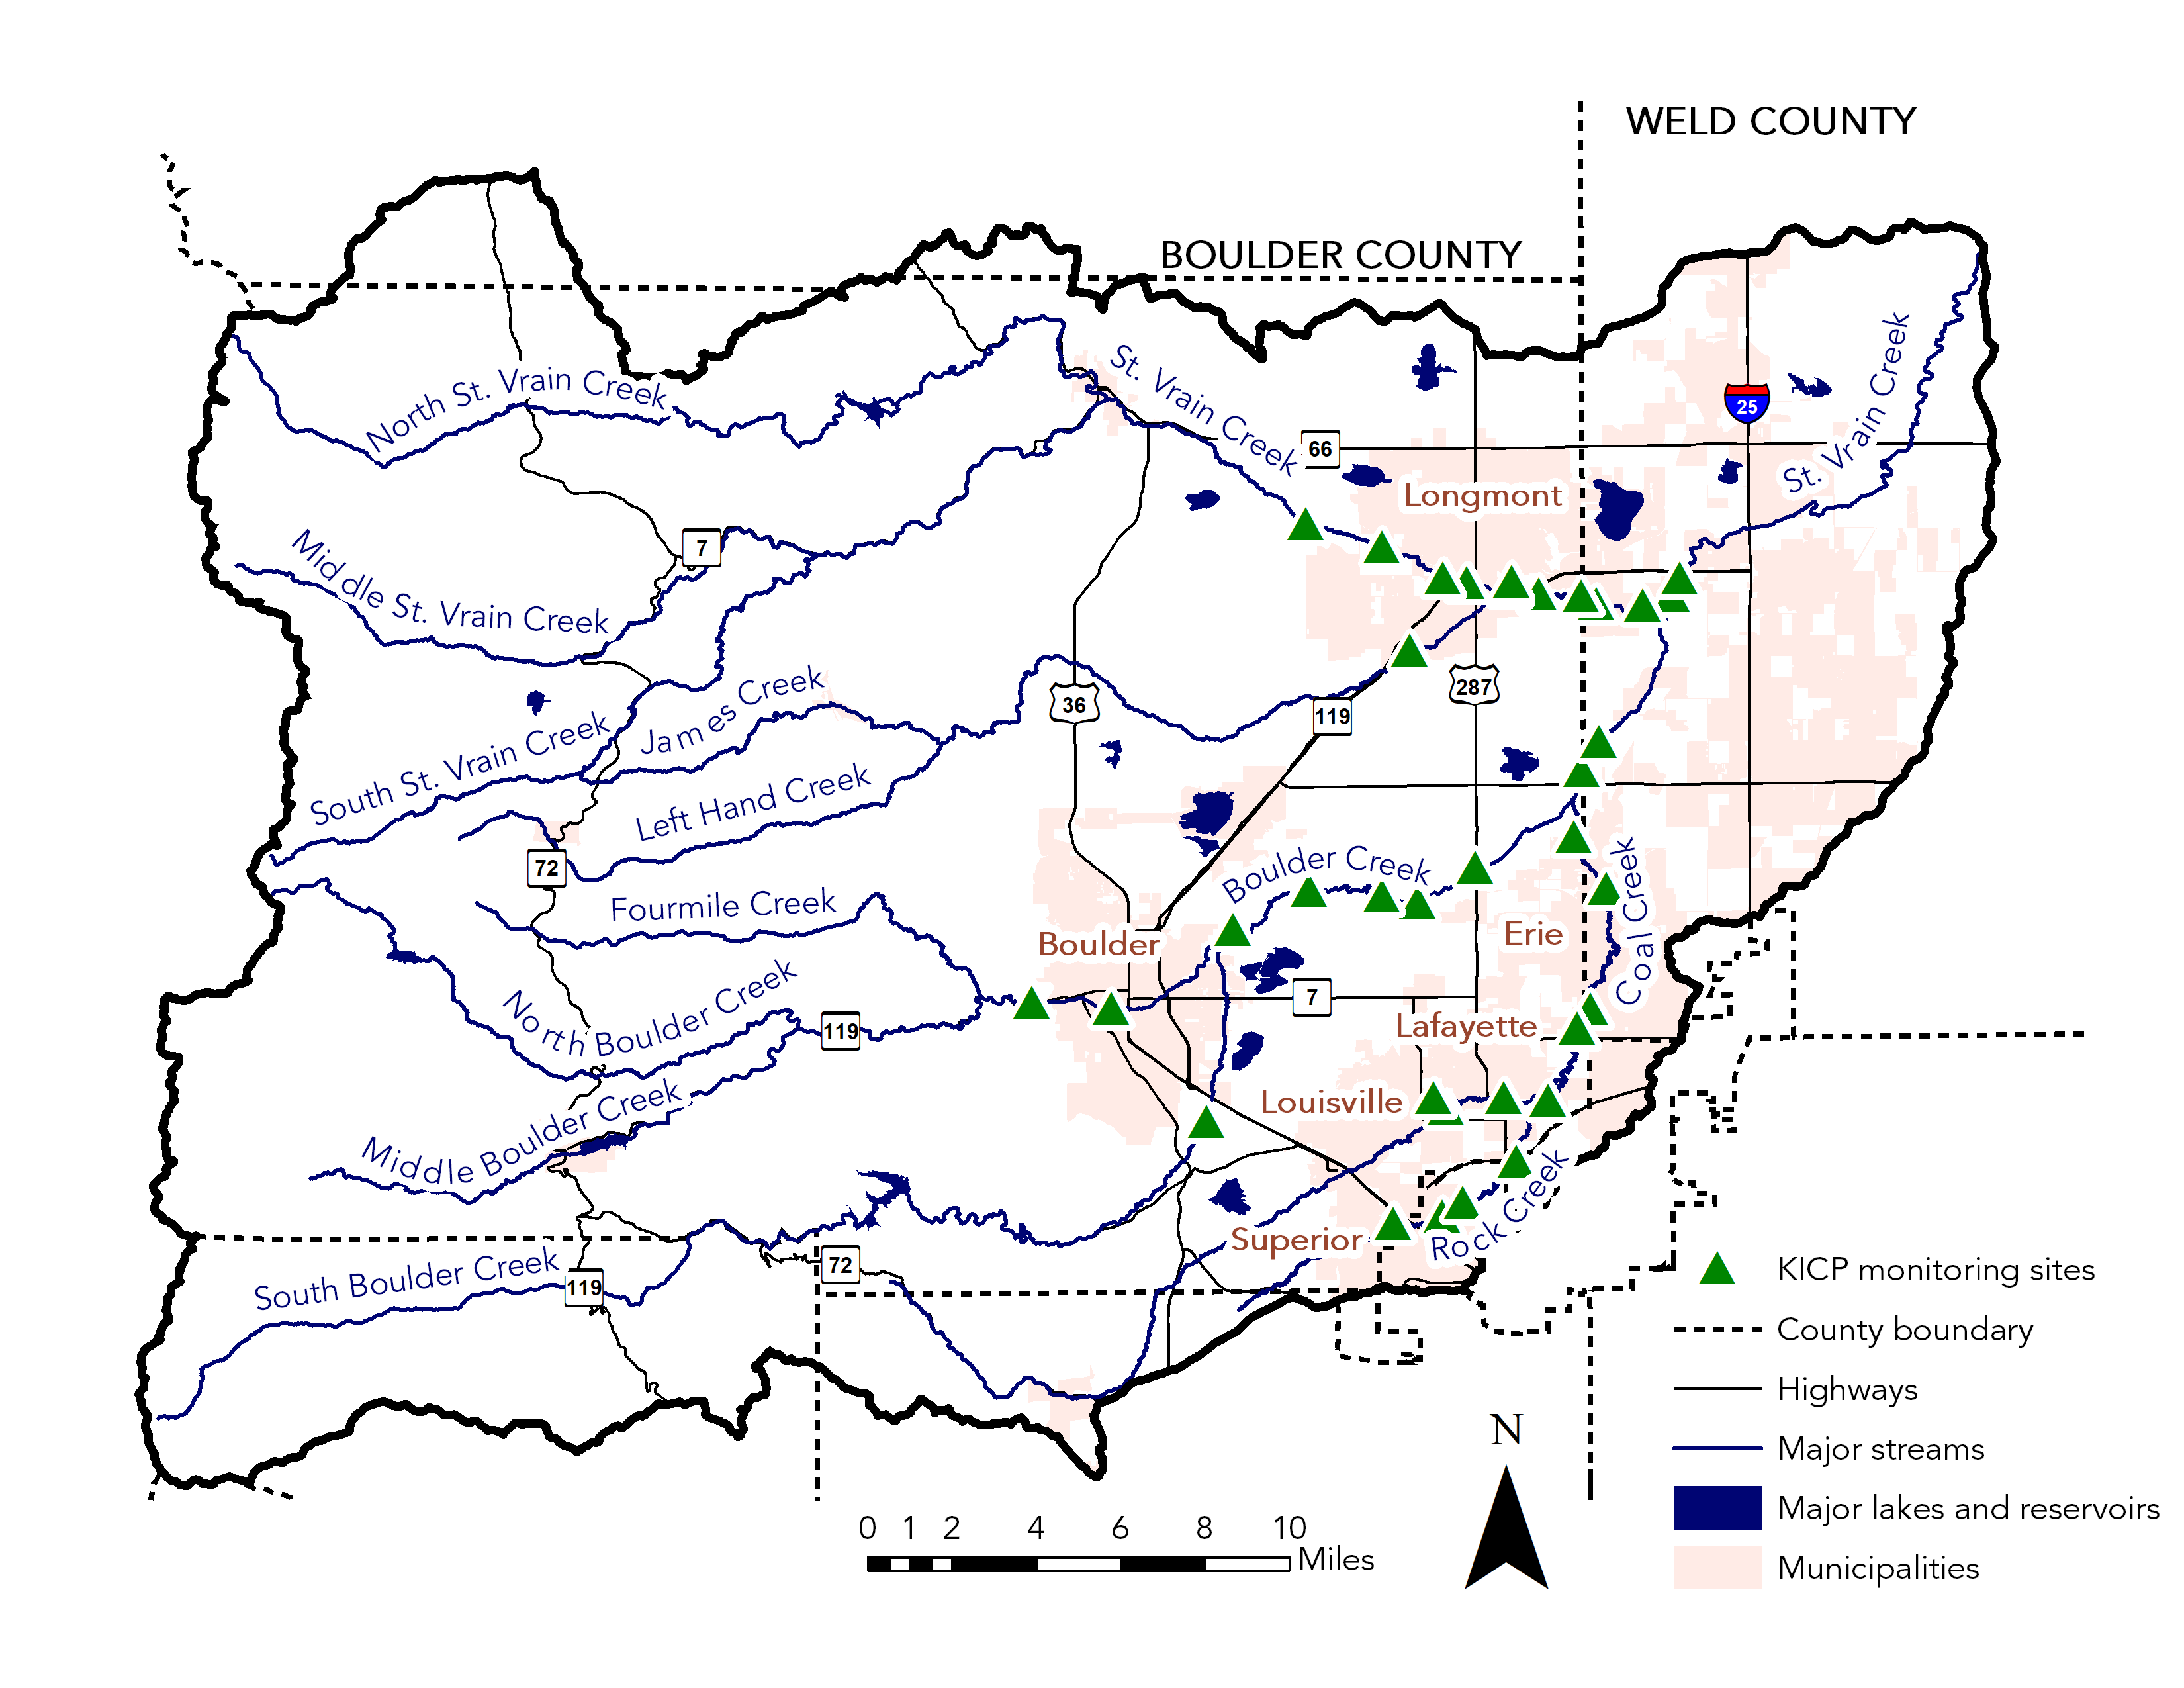
The Keep it Clean Partnership collaborative monitoring program was started in 2014 to collect water quality data throughout the Boulder St. Vrain watershed. Compiling data from all of our municipal partners allows us to look at watershed health more holistically and evaluate trends over time and location, with some data going back over 20 years.

  • 6 participating local governments
  • Over 40 monitoring sites
  • Over 17 water quality parameters
  • Monthly monitoring at all sites
  • Data analyzed every year for major trends